Charts
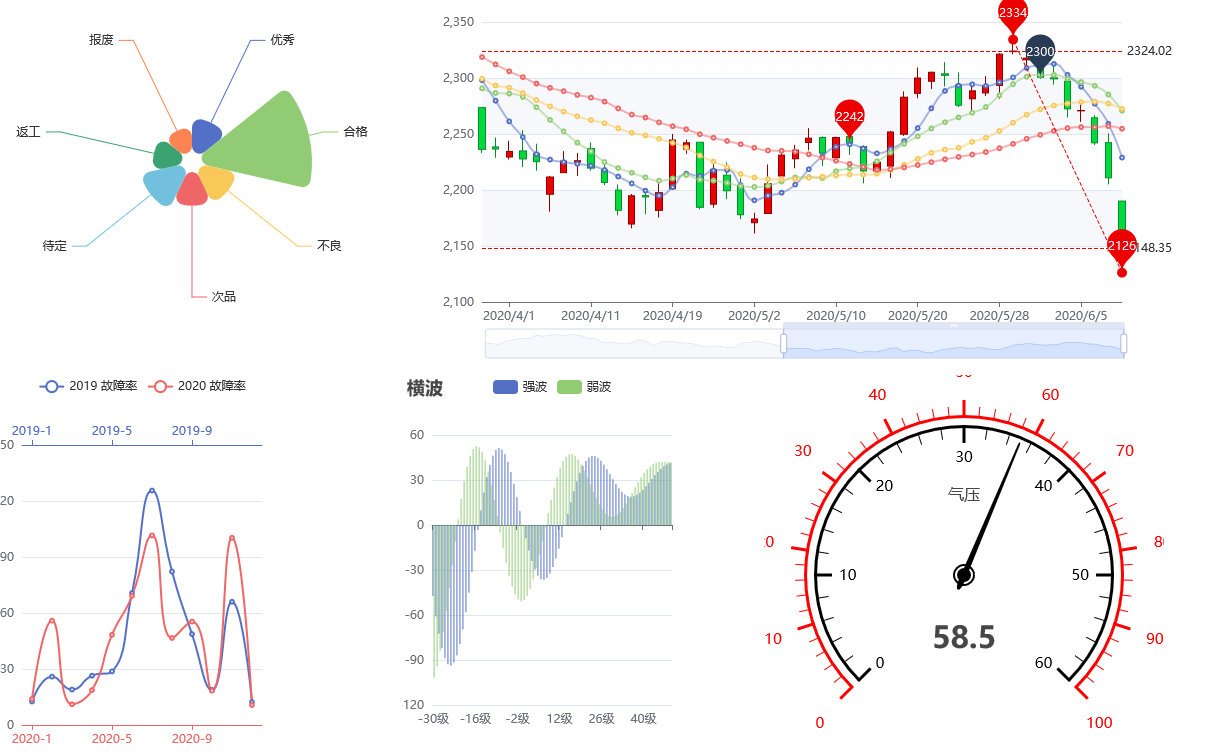
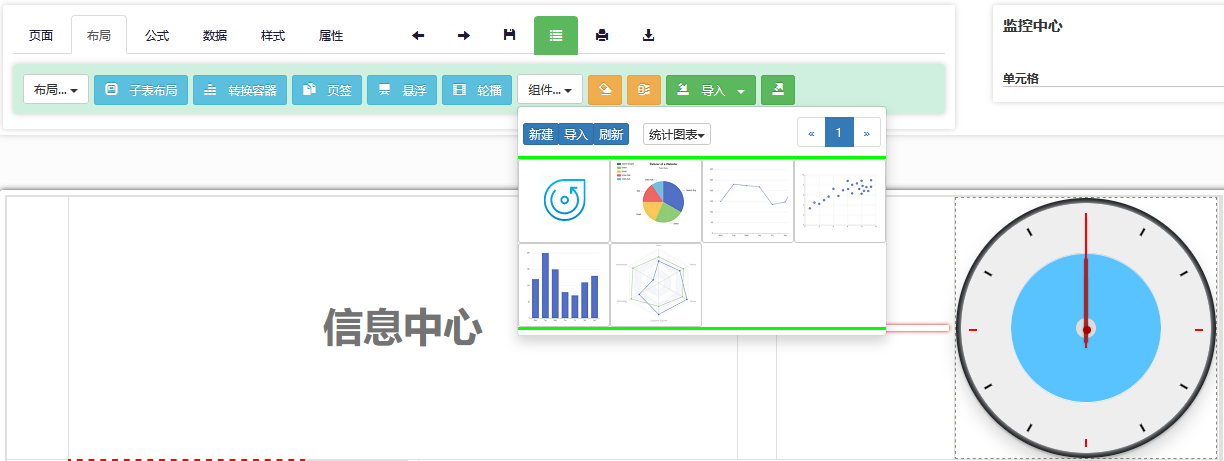
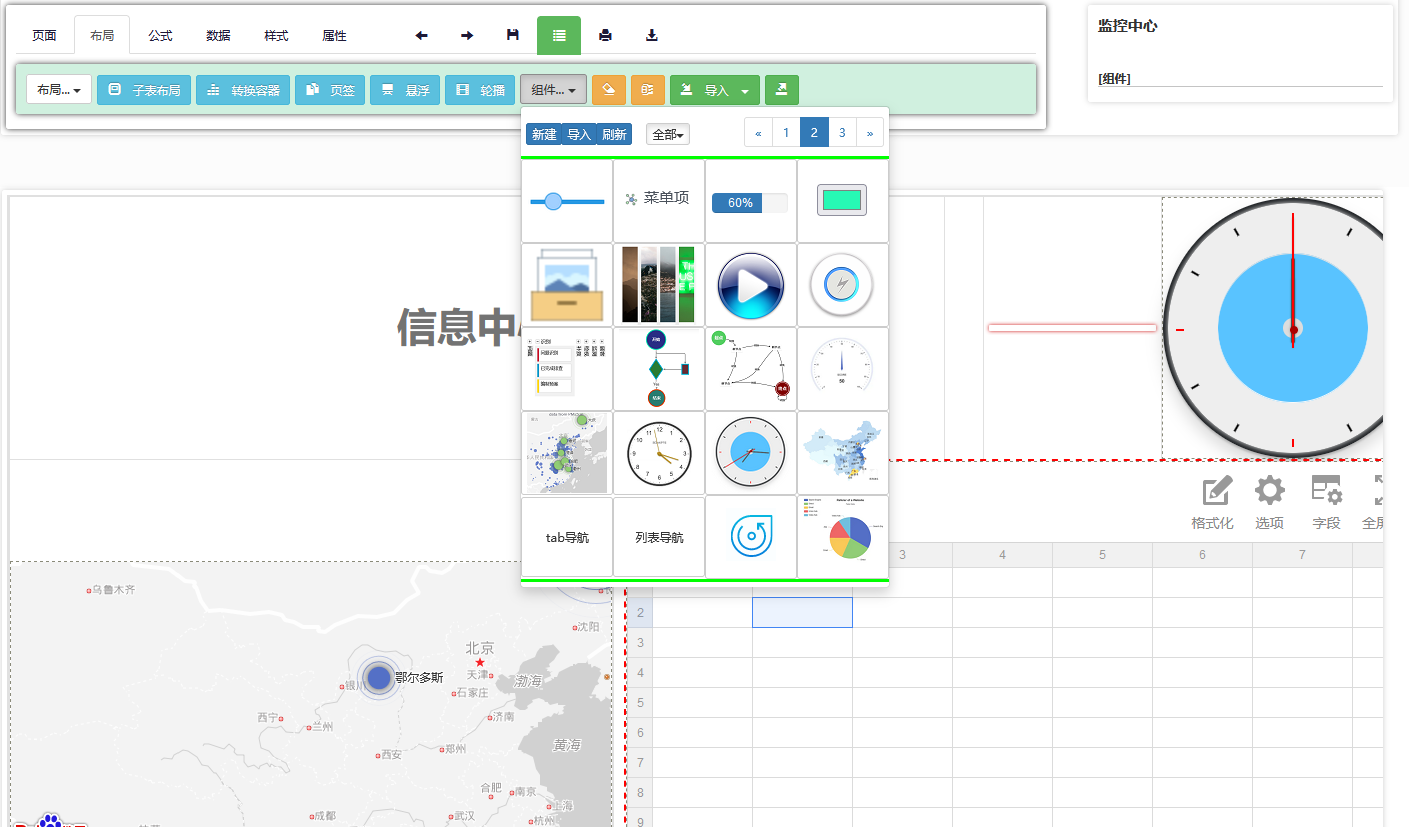
The platform provides customizable components and program templates for all kinds of statistical charts, ready for data configuration and functional extension,
Program extensions on the platform are mainly written in scripting languages such as JavaScript and Python; data is normally configured in JSON format,
and the approach is straightforward and concise.
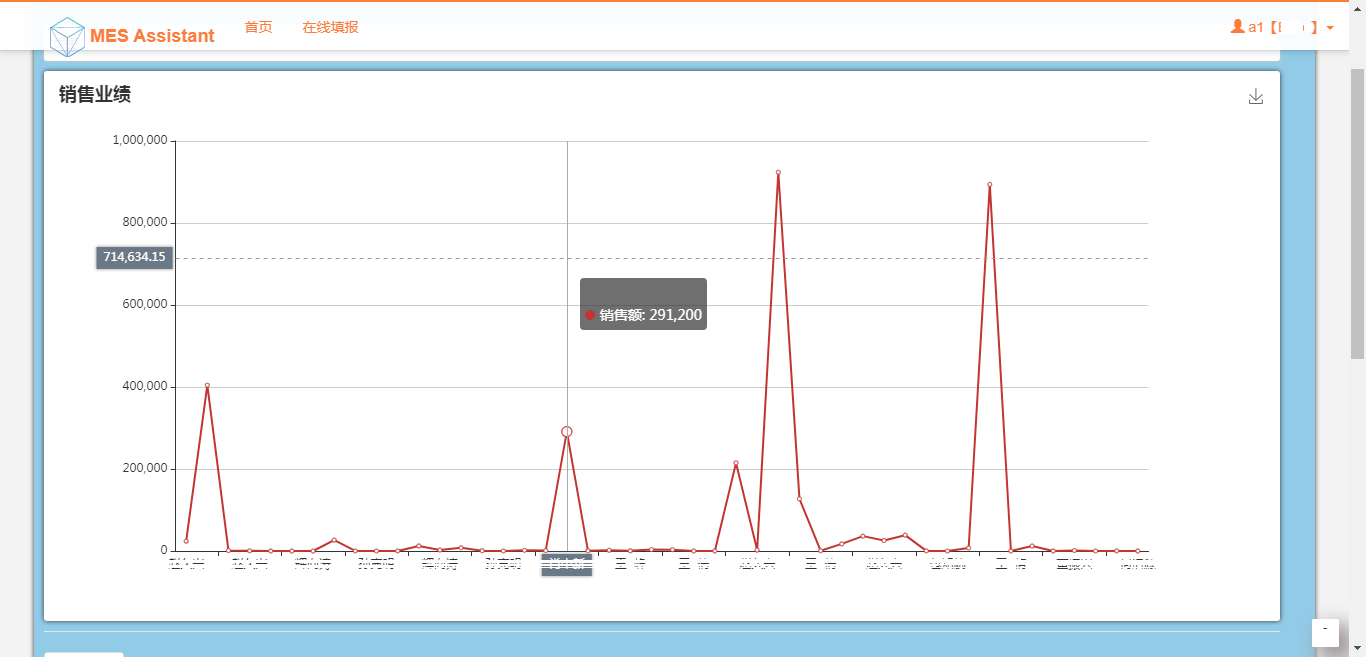
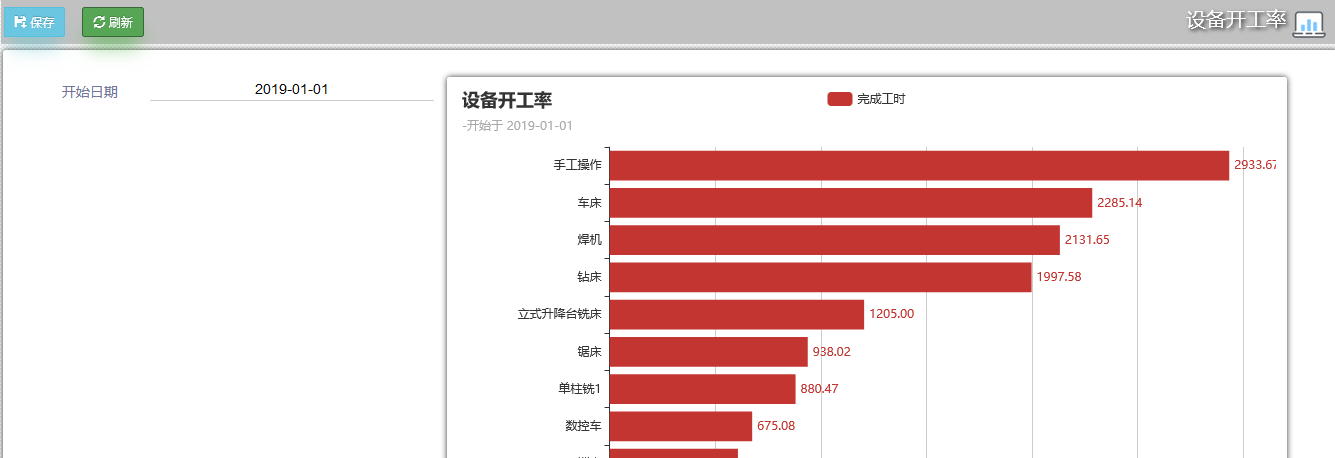
Program extensions make it possible to implement all kinds of statistical and intelligent-analysis algorithms, and to generate and display a rich variety of charts.
Case study: developing a statistical chart plug-in Electronic signature demonstration Designing a project Gantt chart plug-in Data visualization case studies Extending with high-level language interfaces (Python) Extending the platform with Python Developing flow-chart features with integrated components Machine and instrument data collection dashboard (server side) Machine and instrument data collection dashboard (client side) Statistical analysis: line chart example Horizontal bar chart example Line and pie chart example Line chart step by step (1) Line chart step by step (2) Stacked line chart example Tips for tuning chart parameters Using the pivot report plug-in 3D-style visualization dashboard Designing a mobile operation interface